与南师大的李硕老师出了一趟野外,主要是黑河流域中上游的土壤调查。调查内容包括环刀取样和原状土的渗透系数测定。前后十天。
调查点地图如下,基本是将中上游的主要土壤和土地利用类型控制住了。这应该是近些年来黑河流域开展最为系统的一次调查了。

三角为调查点,红色区域为黑河流域上流,紫色为中游区域。

分两小组分别工作,我们小组在达坂山垭口的合影
与南师大的李硕老师出了一趟野外,主要是黑河流域中上游的土壤调查。调查内容包括环刀取样和原状土的渗透系数测定。前后十天。
调查点地图如下,基本是将中上游的主要土壤和土地利用类型控制住了。这应该是近些年来黑河流域开展最为系统的一次调查了。
三角为调查点,红色区域为黑河流域上流,紫色为中游区域。
分两小组分别工作,我们小组在达坂山垭口的合影
出来野外已经是第三天。今天住在祁连山里的野牛沟乡里。这里连联通的信号都没有。
不过很意外,电信3G信号很好。估计是用了移动的网络。
第一天从兰州到张掖。第二天从张掖到民乐,沿途分两个车分两个小组(一组李硕带队,一组我带队)做了6个土壤剖面,内容包括环刀采样,称重,饱和下渗导水率。今天(第三天)从民乐经扁都口、祁连到野牛沟,两小组完成了7个剖面。工作很辛苦,上午6点半起床,晚上9点才吃完晚饭。还要将本子上的记录整理到笔记本电脑上。但工作开展的很顺利。工作将持续8-10天,采集剖面达45个左右。
李硕老师讲,黑河流域这样大规模的土壤采样,是没有前例的。已有的土壤剖面都集中在张掖附近。我们的工作将极大改进流域的土壤资料。
参加工作的南师大学生、寒旱所学生表现的都十分优秀。谢谢大家。
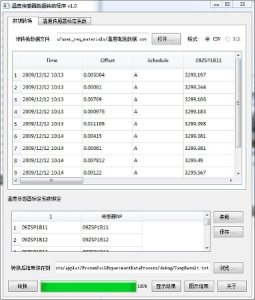
一些截图如下:
主界面
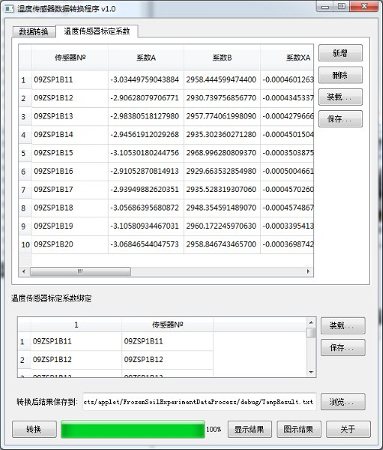
温度转换功能模块界面
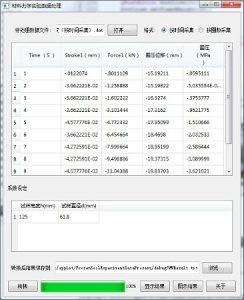
力学试验功能模块界面
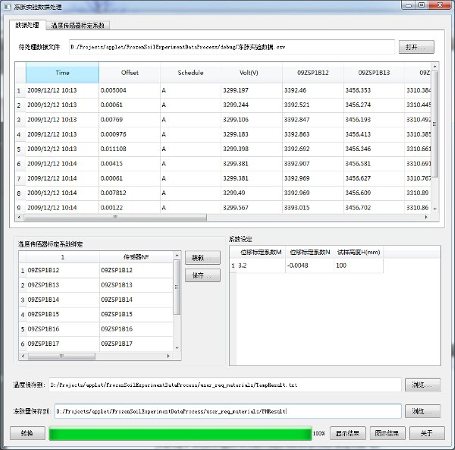
冻胀试验功能模块界面
吃不香睡不好,真是辛苦呀,好在在老板的催促声中,终于赶出了初稿,还来得及吧。
单位里评研究员,我好像论文有欠缺,尽管项目还行,但估计也没得争。该有的总归会有,眼光也需要放远一点,如果勉强只够线也没啥意思,要做到水到渠成,毫无争议才成。再给自己一两年时间吧,多写几个英文文章。
目前工具包集成了遗传算法,二进制遗传算法,模拟退火,快速模拟退火(VFSA),SCPSO(见王书功博士论文),和线性规划。模型部分目前只集成了简单的二水源新安江模型。目标函数包括了NSE、RMSE、BLAS等;优化目标包括最大化和最小化。
工具包使用Qt 4实现,理论上可以在Windows、Linux、Mac等主流平台上编译运行,但我们只测试了Windows平台。
存在的问题:
1. 目前没实现多线程和并行支持(尽管一些算法本身是支持并行),如果计算量过大,会导致界面不响应。
2. 以后如果增加 目标函数收敛 的动态图形界面,就更完美了。

QGIS 1.0出来了,想拿 visual studio 2008 c++ express 编译一下,结果发现依赖的库太多了,还不是一下子能搞定的事。想将这个用起来,刚提交的863任务书将原 arcengine改成 qgis,将swat模型改成 noah,还是尽量的使用开源吧。研究性的东西不应该全用闭源或者商业的东西,不利于成果的推广。
学生应用clips做了一个简单的节水城市评估原型系统,初步演示了,
1. 知识推理引擎可以应用在水资源有关的管理和实践上。知识推理引擎尤其在涉及大量复杂知识规则的系统里,将十分有效;
2. clips与gis的集成,clips与其它应用程序的集成。
开发环境,
clips 6, Qt/win opensource, vc++ 2008 express, arcgis 9.2
我们最近实现了一个多准则决策(Multi-Criteria Approach Decision Making)的一些简单算法,Qt 4实现,代码可以全部主流平台上编译。更多算法以插件的形式添加进来。
value function (analysis matrix -> evaluation matrix)
indicators简单加权实现及solution ranking
Zhuotong Nan ([email protected])
Stage II
Be produced directly from the real-time gauge and WSR-88D radar data received at NCEP.
raingauges:
Radar:
The primary input to the ETA/EDAS precipitation assimilation before 2003.
Stage IV
A mosaic of regional multi-sensor analysis produced by NWS River Forecast Centers (RFCs) and benefits from the RFCs’ manual quality control step
mosaicked from the regional multi-sensor 1h and 6h analyses produced by the 12 ConUS RFCs.
The primary input to the ETA/EDAS precipitation assimilation after 2003. Stage II is only used when Stage IV is unavailable.
In summary,
Since Stage IV benefits from manual QC at the local RFCs, it is generally better than Stage II, which has no manual QC. There are a number of other issues for your consideration:
1. Coverage period: Stage II began to be archived at NCAR on 1 May 1996. Stage IV did not began to be archived until 1 Jan 2002. (NOTE: we have data from 1997 on for OHIO river basin. I guess this statement is for entire continuous continental, rather than for an individual RFC. -Zhuotong)
2. Do you need hourly or 6-hourly analysis? For 6-hourlies, Stage IV is the one to use (if you don’t need the pre-2002 data). Stage IV hourlies have some coverage problem since we do not receive the local analyses from all the RFCs for all hours.
3. How soon do you need the analysis to be available? Stage II hourly analysis is made at 35 minutes after the top of the hour, then re-made twice at 6 hours and 18 hours later. Stage VI runs each hour at approximately 35 minutes past the top of the hour.
4. If I choose Stage II, which type should I use? We recommend the multi-sensor analysis with the exception of early spring – early Aug 2000, when the radar coverage was bad. You might want to use the gauge-only analysis for that time period.
Validation examples:
figure 1 24 hour precipitation accumulative amount on OCT 10, 2004, Stage II (left) and Stage IV (right).
figure 2 Left: Stage II; Right: Stage VI. On Jun 28 2005. Here we can see the variance between them.
References:
1. http://nanzt.info/wp-content/uploads/2008/05/stage2-4.19hydro.pdf
2. http://www.emc.ncep.noaa.gov/mmb/ylin/pcpanl/QandA/
3. http://www.emc.ncep.noaa.gov/mmb/ylin/pcpverif/daily/
Asian Water News Control
* fix the problem it cannot be shown when clicking items from Article module.
+ add cache support (10min).
+ add History.txt.
# make it only visible on home page.