Tag Archives: tutorial

同一门课程多班教学的成绩调整方法

一般讲小班教学(20-30人)效果比较好。但是,如果同一门课程分为几个小班,由不同老师授课,就会经常出现一个问题,即如何让各个小班成绩具有可比性。这是一个非常现实的问题,不同老师有不同的教学风格,尤其是在主观题评价方面,有老师严格有老师相对宽松。但学生们最终的综测成绩时并不区分这些差别,而是直接进行排名。拿到一个公平的成绩是学生们很关心的事情。

为了解决这个问题,我们采用一个曲线调整(Curve)的方法。通过强制不同小班的中位数(Median)保持一致,对每位同学的分数进行非线性调整,从而使不同班级分数具有可比性。这也是很多标准化教学采用的方法(当然可能使用的公式不同)。

Continue reading

Euclidea: Sketches 辅助中学几何动点问题的理解

南卓铜 ([email protected])

我之前介绍过这个ios上的小app,功能很强大。微信有朋友反映说用起来还是有点困难。的确是这样。昨天又碰到小朋友问一个动点问题,他们老师讲的她理解不透。

这个问题是:

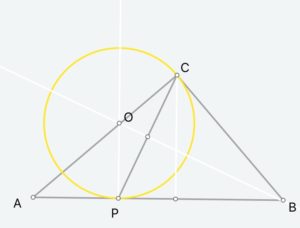
【2014玄武一模】在△ABC中,∠ACB=90°,经过点C的⊙O与斜边AB相切于点P.

  1. 如图1,当点O在AC上时,试说明2∠ACP = ∠B;
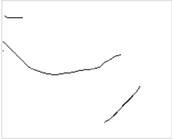
  2. 如图2,AC=8,BC=6,当点O在△ABC外部时,求CP 长的取值范围。
图 1
图 2
Continue reading

Matlab科学数据处理:如何补上缺失的时间序列

Matlab科学数据处理:如何补上缺失的时间序列

Zhuotong Nan (南卓铜, [email protected])

问题提出

假设我们有一个时间序列文件,内容如下

286880 19480223 -5.7

286880 19480227 10.8

286880 19480229 7.7

286880 19480301 -15.7

286880 19480302 3.2

286880 19480303 7.7

286880 19480305 21.2

第一列是站点名,第二列是时间信息,第三列是温度值。时间并不连接,我们经常需要把时间补全,这些时间上的观测以缺失值(比如999.9)替代。即,我们希望是,

286880 19480223 -5.7

286880 19480224 999.9

286880 19480225 999.9

286880 19480226 999.9

286880 19480227 10.8

286880 19480228 999.9

286880 19480229 7.7

286880 19480301 -15.7

286880 19480302 3.2

286880 19480303 7.7

286880 19480304 999.9

286880 19480305 21.2

那么在matlab里要如何实现呢。

基本思路 Continue reading

多元回归 / 多元拟合matlab实现

MatLab内置了很多拟合的功能,比如分布、指数、多项式等拟合。对应的函数是fit。基本用法是:

cfun = fit(xdata, ydata, libname)

其中xdata是自变量x序列,ydata是因变量,libname 是模型名,比如’power1’是 y= a* x ^b 形式,Matlab内置了很多模型,可以从帮助文档里看到。对于这些拟合,MatLab有个图形工作叫 cftool,在命令行里敲入可以打开。

然而我们有时候需要做二元、多元拟合。

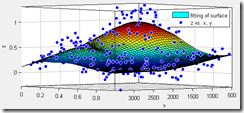
二元拟合,即使用模型 z = f(x, y),在MatLab也叫面拟合 (Surface fitting),有专门的图形工具 sftool,命令敲入sftool可以打开。

但如果是多元拟合,这时我们需要懂一点代码的工作。

其实不管一元、二元,代码级别是一致的。使用的都是fit命令。

对于使用 y = a* x^b这样内置的指数一元拟合,我们可以看到其libname 叫’power1’。所以采用以下命令:

cfun = fit(x, y, ‘power1’)

即从已知x、序列是得到拟合函数。coeffvalues(cfun)可以得到拟合参数,即这个例子里的a、b。如果还需要得到拟合指标,使用[cfun gof] = fit(x,y, ‘power1’),返回的gof包括了R squre、RMSE等多种指标。

对于二元拟合,比如 使用 z= a + b*sin(m*pi*x*y) + c*exp(-(w*y)^2模型进行拟合,采用类似的代码:

ft = fittype( ‘a + b*sin(m*pi*x*y) + c*exp(-(w*y)^2)’, ‘indep’, {‘x’, ‘y’}, ‘depend’, ‘z’ );

opts = fitoptions( ft );

opts.Display = ‘Off’;

opts.Lower = [-Inf -Inf -Inf -Inf -Inf];

opts.StartPoint = [0.741864193163802 0.681571628918889 0.811658042300087 0.275716137656952 0.738979809065491];

opts.Upper = [Inf Inf Inf Inf Inf];

opts.Weights = zeros(1,0);

[fitresult, gof] = fit( [x, y], z, ft, opts );

其中fittype自定义了需要的二元函数。其中’indep’指明自变量、’depend’指明因变量。即通过fittype构造一个二元拟合模型,说明其中的自变量和因变量,定义拟合的选项,这些选项经常可以不要专门指定,采用默认的即可。然后使用 fit的扩展形式得到拟合函数。

对于多元拟合,一个函数是 regress多元线性回归,另一个是nlinfit 非线性回归。两者都在statistic toolbox里。regress的基本形式是

b = regress(y, X)

其中X是多个自变量,y是因变量。

对于多元非线性拟合,可以使用nlinfit,基本形式是:

beta = nlinfit(X,Y,modelfun,beta0)

其中modelfun构造非线性多元模型,比如以下例子:

beta = nlinfit(X,y,@hougen,beta0)

使用一个hougen函数作为拟合模型,这个函数可以自行构建。

Matlab也提供了非线性多元拟合的图形化工具nlintool。

此外类似的还有 fitnlm函数提供了类似nlinfit的非线性回归,用法与nlinfit类似,但对返回结果进行包装,可以更简便的使用诸如predict等函数对非线性模型进行预报计算。

Image(1)

制作符合学生信息表要求的数码照片

小学生最近填学生信息表,要求提交一张数码照片。朵朵小朋友的事情就落到我头上了。照片的要求还多多。

比如,1. 淡蓝色背景。2. 照片规格:358像素(宽)x 441像素(高),32mm x 26mm, 分辨率300dip以上。(原文如此)。3. jpg格式。4. 文件大小小于60K。

大家注意的32mm x 26mm没有,这里32mm和26分别是什么,都没有讲,与像素高宽对比,才能知道,32mm只能是高,26mm是宽。然后细心的可能会注意到另一个很脑残的事情,按358像素宽和26mm宽的比率,这个分辨率并非300dpi或者是一个整数,而是349.758xxxx。如果在后期处理的时候,不注意到这个分辨率的调整,是怎么也不可能同时满足像素和实际尺寸的要求的。脑残的是也不知道定一个整数的dpi。

下面讲如何在photoshop里进行简单的处理以满足这些要求。

1. 我的原文件是朵朵的护照照片,原大小是 602像素x602像素,300dpi。白底。

image

2. 打开原照片。在Image > Image size里进行调整。

确认constrain proportions打勾,在resolution里填那个脑残的比例,即349.758 pixel/inch(即dpi)。在document size的height里填 3.2 单位是cm。这时由于constrain proportions打勾,会按比例缩放。点击确定。

image

3. 在view > rulers里把rulers打勾,即显示标尺。选择剪裁工具,从最左边开始,拉选 358个宽的像素。如图。

image

不是严格的358没有关系,以后可以细调。按向右的方向键把框框移到合适的中间位置。如图。

image3

回车键确认。正式进行剪裁。

4. 重新打开Image > Image size,这时如图

image

注意到Width并非 358。把Constrain Proportions的勾去掉,把Width 改为 358。这时注意到 Document size里的Width 也相应变为 2.6 cm。确认即可。现在已经在正确的尺寸了。

5. 从网上找一个淡蓝的证件照。比如这个http://nanzt.info/wp-content/uploads/2013/05/chenqingfa_1089898576.jpg。下载保存。在photoshop里打开这个证件照。用吸管取其背景淡蓝色。或者直接用 # 66ccff这个颜色值设置前景色。

6. 在朵朵小朋友的照片里,用魔术棒点了一下白色的区域,这时整个白色区域就全部被选上,如图。

image5

7. Edit > Fill 里,使用前景色填充,确认后如图。

image

8. 文件 > 另存为,取合适的文件名,在jpg 选项里,注意文件大小,拖拉 质量,使得右边上的文件大小小于60KB(可以适当大于60KB,保存后的实际大小会小于右边这个数字)。然后保存。

image

9. 恭喜,一个满足全部要求的照片完成了。

10. 不要忘记,学校是要求用身份证号来命名的。

ThinkPad x220 更换硬盘及数据迁移

Zhuotong Nan ([email protected])

原x220 4286-CTO 是320GB 7mm硬盘。已经没有空间了。买了一块500GB的日立 Hitachi Z7K500 (7200转)7mm硬盘。我此前写过一个x200更换硬盘并迁移数据的帖子。那里面描述的方法肯定是可以用的。但这次尝试另一种更为简便的方法。

1. 笔记本里原硬盘的数据必要备份。以免万一。

2. 拆硬盘的视频可以看这里,从2分05秒开始。准备后十字螺丝刀。

3. 用Orico 6628 series 的tool free dual bay hard drive dock 进行盘对盘clone。注意,源盘和目标盘一定不要弄错了,所以在切换为clone模式,按下start前务请确认没有错。


*一定注意源盘(source)和目标盘(target),不要放错。源盘要放原笔记本里的盘,目标盘是新的500G盘。

4. 开始clone,指示灯为闪红,大约需要30分钟。结束的时候有三声鸣音,指示灯变蓝后为合适了。

5. 把新盘装进x220。重启。

6. 进disk management,把未分配的空间并入原盘(my option),或者建新盘。如果built-in功能不好用,建议用acronis的相关工具。

7. 扩展后的结果如下图。

Image(4)

一切OK。

AHK实现批量网页数据提取

Author: Zhuotong Nan ([email protected])

AHK是很好用的在windows下实现自动化的脚本语言,对于有一定编程基础的童鞋,很快就可以上手写代码。ahk的官方网址是http://www.autohotkey.com/,其forum里有大量的他人写好的脚本。

本文实现一个从网页里自动提取数据的一个例子。

目的

从40407.com网站里自动批量得到《武林3》70区豪侠礼包代码。原始网站界面如下,

1. 进入http://fahao.40407.com/11417.html,点击“淘号”按钮,如果未登陆,则提示登录。登录后弹出淘号界面如下图,

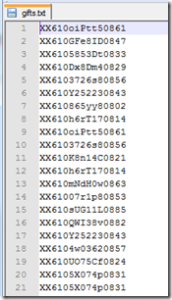
从界面中获取以XX打头的15位代码。

2. 关闭“查看卡号”,然后重复步骤1,可以得到一系列的代码。

现在的目的是实现其自动化,并把得到的代码保存到一个文本文件(gifts.txt)里。

实现

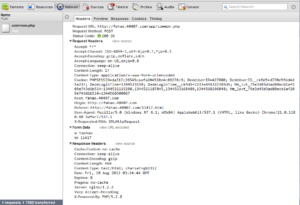
1. 点击“我要淘号”时,本地与远程有一个通讯。利用chrome自带的inspect element的network功能(也可以用任何网络分析工具),在“我要淘号”上右键选 inspect element, 到Network tab上,这时点一下“我要淘号”执行一次通讯,Network将捕捉到通讯信息。

我们可以看到通讯的header。我们需要做的是模拟chrome的通讯用ahk来实现。

2. ahk有几个有用的他人写的http通讯脚本,一个叫httpquery,一个叫httprequest,都很优秀,但前者2010年后已经不再继续支持,并且不支持cookies文件头。而cookie信息是我们这个任务里的关键,否则“我要淘号”返回是要求登陆的信息。httprequest可以从这个网址下载:http://www.autohotkey.com/community/viewtopic.php?t=73040

3. 代码实现。本代码实现了自动获取500个号码。

; Author: Zhuotong Nan ([email protected])
; Date: 8/8/2012

loop, 500
{
url := “http://fahao.40407.com/app/common.php”
data := “a=taohao&id=11417”

header :=”Cookie: PHPSESSID=da317c26545caafa204520e4c89276c9; DedeUserID=427080; DedeUserID__ckMd5=d770e5fdd4d5a237; DedeLoginTime=1344523159; DedeLoginTime__ckMd5=2233e446322305d5; Hm_lvt_75e3d45d3ad80ecb1af209e743d1b514=1344521115290,1344521187845,1344523168489; Hm_lpvt_75e3d45d3ad80ecb1af209e743d1b514=1344523168489`nReferer: http://fahao.40407.com/11417.html`nConnection: keep-alive”
options :=””

bytes := httprequest(url, data, header, options)

sleep 500

;parse gift code
pos:=Regexmatch(data,”XXw{13}”)

if pos!=0
{
code := substr(data,pos,15)
fileappend,%code%`n,gifts.txt
}

sleep 1000

fileappend,%data%`n,test.html
}

#include httprequest.ahk

ESC::
exitapp

4. 注意httprequest有4个参数,参数1是访问的地址,参数2是上传的数据(post data)和下载过来的内容(放同一个参数里),参数3是上传的http头,响应的http头也在参数3里,参数4是选项。我们需要使用的是前3个参数。注意参数3 header的构造,不同的key-value对使用分行符(`n)来分隔。而且这里必须要增加cookie信息,这个信息可以从chrome里分析得到。传回来的数据存放在参数2,data里。

5. 使用了正则表达式,从下载过来的data 里进行pattern分析。礼包代码是以XX开头的15长度的大小写字母和数字组成。表达式为XXw{13}。

6. #include httprequest.ahk 把httprequest脚本包括进来,所以前文可以调用httprequest函数。

7. 获取的代码存放在 gifts.txt里。

8. 使用本代码前,必须事先用chrome (或者IE等别的浏览器,需要对应获取其cookie)登录成功。按esc键随时退出。

结论

本文演示了使用AHK从网页自动批量获取指定数据。使用了httprequest方法,其中关键是必须维持cookie信息。

A Lab for using the PIHMgis and PIHM model (II)

Zhuotong Nan (南卓铜, [email protected])

DEM processing

In this part, we will show you how to delineate a watershed with inputs of DEM(Digital elevation model) and outlet location. Watershed delineation is necessary for any distributed hydrologic model. Although hydrologic models use different software to implement the delineation, the underlying idea and steps are generally common.

1. Open PIHMgis by double clicking the PIHMgis_v2.0.0 shortcut created in the previous section.

2. Enable PIHMgis.

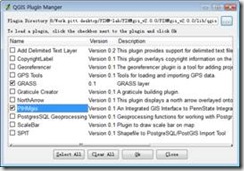
Open Plugin Manager… in the QGIS Plugins menu, tick the PIHMgis item (Figure 3), and press Ok.
clip_image002

Figure 3 QGIS Plugin Manager

Now the PIHMgis toolbar appears as shown in Figure 4.

clip_image004

Figure 4 the PIHMgis v2.0.0 toolbar

3. Load DEM to PIHMgis for displaying.

Layer > Add a Raster Layer…, select lab3.shale.hillsDEMsh_elev.asc.

This DEM file is in ESRI ASCII grid file format. If you have files in ESRI binary grid format which is a proprietary format, you need to convert them to ASCII format by using some ArcInfo command or by some third party tool, such as gdal_translate available from the GDAL website at http://www.gdal.org/.

The map view of the DEM file looks like as following (Figure 5),

clip_image006

Figure 5 DEM map view in QGIS

4. Save as a QGIS project. File > Save Project As…, in the Save As dialog, navigate to the directory of lab3.shale.hills, type “sh” for the file name, and then click Save.

Note: During following steps, please save the project frequently. If the project is crashed, you can restore to the previous session by open the project you saved.

5. Fill pits.

Question: Why do we need to fill pits for a DEM file prior to further watershed delineation?

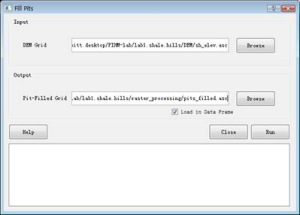
Click the small arrow next to the Raster Processing on the PIHMgis toolbar and then select Fill Pits. This will bring up the Fill Pits dialog (Figure 6).
clip_image008

Figure 6 The Fill Pits interface

Select sh_elev.asc as the input DEM grid and name the output pit-filled grid as “pits_filled.asc” under the “raster_processing” directory as shown in Figure 6. Press Run to start the pit filling process. Click “Close” to dismiss the dialog after the process is done. The pit-filled DEM will automatically be loaded into the QGIS data frame.

6. Calculate flow direction and flow accumulation.

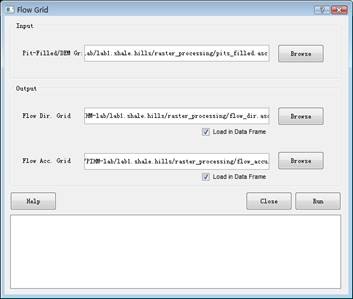
Use the command Raster_Processing > Flow Grid to open the Flow Grid window (Figure 7).

Set pits_filled.asc as the input; flow_dir.asc and flow_accu as the output flow direction grid and flow accumulation grid respectively, also under the raster_processing folder.

Click Run to start the processing. After done, click Close.
clip_image010

Figure 7 Flow Grid

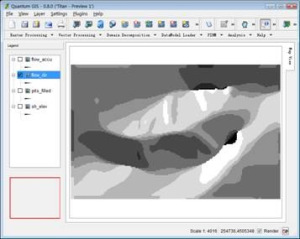
Both flow_accu and flow_dir are shown in the QGIS map view (Figure 8).

Note: the direction codes are following: 1 – east, 2 – North east, 3 – North, 4 – North west, 5 -West, 6 – South west, 7 – South, 8 – South east.
clip_image012

Figure 8 Flow direction generated by PIHMgis

Tip: Within the QGIS framework, visibility of a GIS layer can be switched using the table of contents on left.

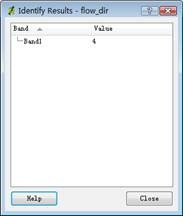
Tip: The identify tool clip_image013 can be used to identify features by clicking on them in the right map view panel. For example, click on the flow_dir item in the table of contents to make it selected, and then use the identify tool to click over the map view, the Identify Results dialog will pop up and show the value of the clicked feature (Figure 9), here, value of 4 means the point of interest has a flow direction towards north west.
clip_image015

Figure 9 Identify results

7. Generate stream grid

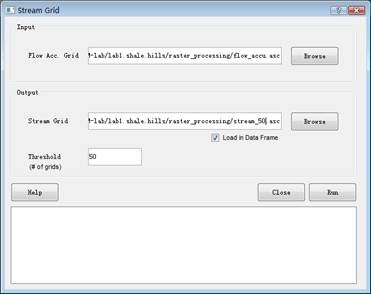
Select Raster Processing > Stream Grid to make the Stream Grid dialog visible, set the flow accumulation grid generated in previous step, i.e., flow_accu.asc, as the input grid, and then set output stream grid to stream_800.asc with a threshold value of 800 (number of grids). Press Run to generate stream grid (Figure 10).
clip_image017

Figure 10 Generate stream grid with a threshold value of 50.

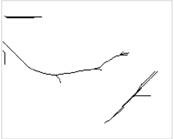
Don’t close the Stream Grid window. Set thresholds to 300 and 800 respectively to compare the resulting stream grids (stream_300 and stream_800 accordingly, Figure 11) and run again.

clip_image019clip_image021clip_image023

Figure 11 The generated stream grids with thresholds set to 50, 300 and 800. (left: 50, middle: 300, right: 800)

Close the Stream Grid dialogue by clicking on the Close button.

Question: How to determine an appropriate threshold for a watershed of interest?

8. Generate the stream order grid (known as Link Grid in PIHMgis)

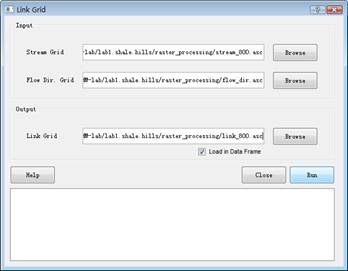
Select Raster Processing > Link Grid to pop up the configure interface (Figure 12). Select stream_800.asc as the input stream grid and flow_dir.asc as the input flow direction grid, and set the output link grid name to link_800.asc (saving to the same raster_processing folder). Click Run to begin processing. After done, the link grid will be shown on the map view panel if the Load in Data Frame option is checked.
clip_image025

Figure 12 Generate a stream order grid

9. Create a vector file of stream network

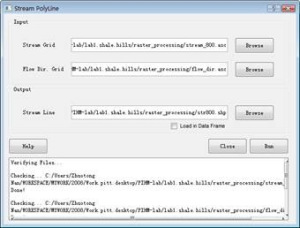
Select Raster Processing > Stream PolyLine to make the interface appear (Figure 13). Set inputs with stream_800.asc and flow_dir.asc generated by previous steps and set the name of the output stream polyline file to str800.shp. Click Run to process it after parameters are specified.
clip_image027

Figure 13 Create a vectorized stream network

10. Generate catchment grid and its corresponding vector file

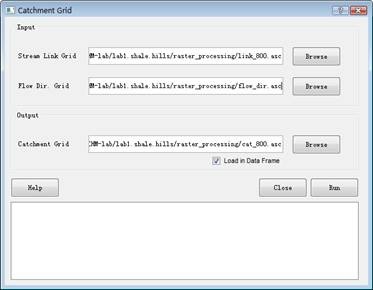
Select Raster Processing > Catchment Grid to bring up the catchment grid generation interface (Figure 14). Set Stream Link Grid to link_800.asc, Flow Dir. Grid to flow_dir.asc, and output Catchment Grid to “cat_800.asc”. Both input and output files are located in the raster_processing directory.

Click Run to start calculating the catchment grid. Click Close to dismiss the dialog.

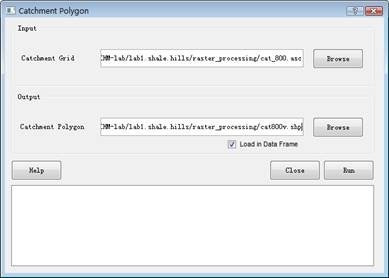
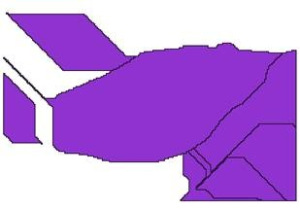
Select Raster Processing > Catchment Polygon to display the interface for converting grid catchment file to vector (Figure 15). Set input to cat_800.asc and output to cat800v.shp. Run to start the processing and Close to dismiss the window. The resulting catchment polygons are shown on Figure 16. Note: the color to render the polygons might not be same as that on the Figure 16, as it is determined by QGIS automatically.
clip_image029

Figure 14 Catchment grid generation interface
clip_image031

Figure 15 Convert catchment grid to vector
clip_image033

Figure 16 Resulting catchment polygons

11. Extract the watershed boundary of interest

The current PIHMgis version 2.0 does not provide such a function to clip the watershed boundary under study and stream network within it. We need to do this by help of other GIS software such as ESRI ArcInfo, or by using QGIS editing capability demonstrated below. In the future version of PIHMgis, this functionality will be implemented. To determine the boundary of a watershed, the outlet location should also be specified.

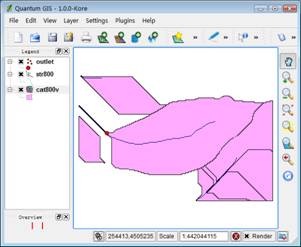
Open QGIS 1.0, load cat800v.shp and str800.shp generated in previous steps to the data frame using Layer > Add Vector Layer…, and then load outlet.shp, which contains outlet location. The view now looks like Figure 17.
clip_image035

Figure 17 QGIS 1.0 with stream network, catchment polygons and outlet layers loaded

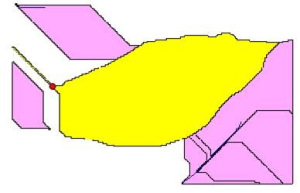
Click on cat800v within the table of contents to make it the current layer. Use “Select Features” tool (Figure 18) to select the watershed polygon of interest (Figure 19). The selected polygon is now in yellow. If the tool is invisible, just drag the toolbar to a new place to make fully appeared.

Students are advised to have a look at all built-in toolbars, making them familiar with all those often-use tools.

clip_image037

Figure 18 The Attributes toolbar

clip_image038

Figure 19 Select the watershed of interest

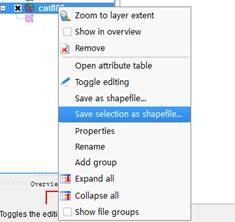
Right click the cat800v item and select “Save selection as shapefile…” to save the selected polygon (Figure 20) to a new shapefile, here, “cat800v_sel.shp”, under the “raster_processing” folder. If you are required to select a project, click OK to use the default one.

Note: The default project probably is not correct, but does not matter with following operations. You can change the project in a layer’s property window later.
clip_image040

Figure 20 Save selection as a new shapefile

Similarly, select the corresponding stream from str800 and save as a new shapefile “str800_sel.shp” (Figure 21), also into the “raster_processing” folder. If you are required to select a project, click OK to use the default one.

clip_image042

Figure 21 Select the corresponding stream, shown in yellow.

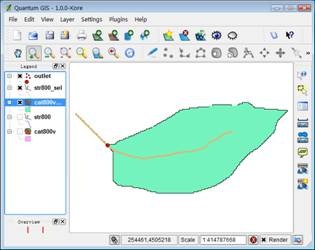
Load str800_sel and cat800v_sel into the QGIS map view. Drag layers up or down to rearrange layers’ visibility. Uncheck str800 and cat800v to hide them. Now the map view looks like Figure 22.
clip_image044

Figure 22 Load str800_sel and cat800v_sel and hide str800 and cat800v

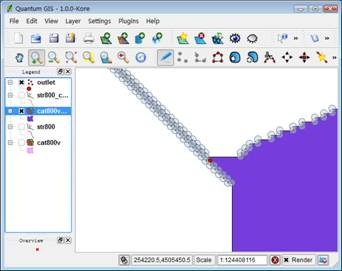
Make str800_sel disappear. Select “cat800v_sel” layer, and use “zoom in” tool (the one w/ magnifier icon and a plus symbol shown in Figure 23) to enlarge the area near the outlet. Click “Toggle editing” tool (the one w/ pen icon shown in Figure 23) to make the current layer editable (Figure 23). Now the other tools on the Digitizing toolbar are also available when the layer enters into edit mode. The tools may be hidden, in this case drag toolbars to a blank place to make all tools shown.
clip_image046

Figure 23 cat800v_sel in edit mode

Click the Split Features tool. Draw a curve to cross the outlet so as to split the whole polygon. Right click to finalize the curve; the Split Features will then split the polygon. Click the “Toggle editing” again to make the layer back in the normal view mode. Make sure saving it if you are asked to save the features.

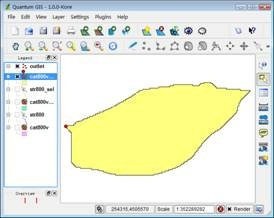
Use “Select Features” tool to select the large polygon right to the outlet. If the previous operation has been done successfully, only the large part will be selected and the upper left part remains unselected. Save the selected polygon to a new shapefile named “cat800v_clip.shp”. Load cat800v_clip to the map view. It now looks like as shown on Figure 24.
clip_image048

Figure 24 Clipped watershed boundary

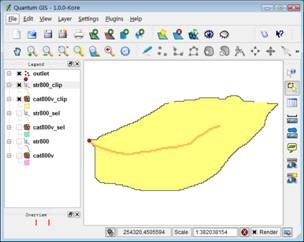
Similarly, we also split the str800_sel.shp. Make it visible and editable, draw a curve to split it across the outlet, save the operation, and then export the desirable line (on the right) to a new shapefile, “str800_clip.shp”. (Figure 25)
clip_image050

Figure 25 Clipped stream network

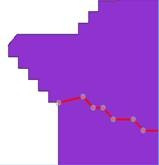
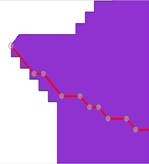
Zoom in the outlet area, and carefully edit the stream polyline making its end node locate on the watershed edge. However no necessary exact alignment is needed. Tools for vertex editing are shown in Figure 26. The final stream line looks like as in the Figure 27. Save the stream file after done.

clip_image052

Figure 26 vertex editing tools. Left: move vertex; middle: add vertex; right: remove vertex
clip_image054 clip_image056

Figure 27 Align the end node of stream line to the boundary. Left: original; right: edited

Close QGIS 1.0.
A Lab for using the PIHMgis and PIHM model (I)

Zhuotong Nan (南卓铜, [email protected])

Set up work place

1. Download PIHMgis version 2.0 from the URL:

http://www.pihm.psu.edu/PIHMgis_v2.0.0/PIHMgis_v2.0.0.zip

Download Shale Hills PIHMgis data files from the URL:

http://cid-0ea641a5a7f665a1.skydrive.live.com/self.aspx/Public/shale.hills.pihmgis.data.zip

Download qgis.1.0 from the URL:

http://cid-0ea641a5a7f665a1.skydrive.live.com/self.aspx/Public/qgis.1.0.zip

Note: The current PIHMgis v2.0 is built with QGIS 0.8 preview version and cannot run with QGIS 1.0 because APIs of those two version are inconsistent. The stable QGIS 1.0 version provides us a much better user interface and richer functionality than version 0.8. We will use QGIS 1.0 editing functions to manipulate vector data. The development team of PIHMgis is working on the migration to QGIS 1.0, which might be available in near future.

2. Make a directory “PIHM-lab”, and then extract “PIHMgis_v2.0.0.zip” to this directory. Go to this PIHMgis_v2.0.0 folder, locate “PIHMgis_v2.0.0.exe”, make a shortcut and rename the shortcut to “PIHMgis_v2.0.0”, and then copy this shortcut file to the directory “PIHM-lab” (our lab root directory).

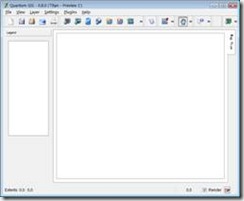
Clicking the shortcut will bring up the Quantum GIS (QGIS) window, as shown Figure 1. Click “X” to close QGIS.

clip_image002

Figure 1 the QGIS 0.8 preview version interface coming with the PIHMgis. Note, the interface might be shown in different language if your computer locale is not set to English.

3. Create a directory “lab3.shale.hills” under “PIHM-lab”. Extract “shale.hills.pihmgis.data.zip” to the “lab3.shale.hills” directory.

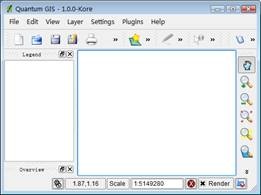
4. Extract qgis.1.0.zip to the directory “PIHM-lab”, go to “qgis.1.0bin”, make a shortcut “qgis” for qgis.exe under this folder, and then copy this shortcut to the directory “PIHM-lab”. Click the qgis shortcut to open it, making sure it can work. It looks like Figure 2.

clip_image004

Figure 2 the QGIS 1.0 interface

使用matlab拟合Gamma分布

南卓铜 ([email protected])

任务描述: 有一批数据,需要将其histogram拟合成Gamma分布,histogram分20个bin,从0到100。结果如下图所示:

hist_dist_final

实现步骤:

1. 装载数据进来,数据文件是data.for.hist.txt,文件结构是一列无header的数据,共43个数据。

>> data=load(‘data.for.hist.txt’)

data是43×1的矢量。

2. 打开distribution fitting tool

>> dfittool

选择Display type为Density(PDF)。点击Data…,弹出Data对话框。

在此对话框内,设置Data为 ‘data’矢量,Censoring和Frequency为 none。设置data set name为dataset,然后点击 Create Data Set。

点击Set Bin Rules,设置Bin width为5。其余不变,OK确认关闭Set Bin Rules。这时,我们将data的histogram设置为每个bin长度为5。在不同的应用里,bin根据具体情况调整。关闭Data对话框。

3. Gamma拟合

点击New Fit…,在New Fit对话框里选择Data为dataset,Distribution为Gamma,点击Apply进行拟合。点击Close关闭New Fit对话框。

此时,看到下图的效果:

image

我们需要修改它的X域,使之匹配我们的histogram的X最大值100。点击Tools菜单下的Axes Limit Control,将X Lower Limit和X Upper Limit更改为 0和100。

image

4. 导出成figure

使用File菜单下的Print to Figure导出成figure。对figure进行必要修改。

>>figure(1)  (注,如果已经打开多个figure窗口,导出的figure序号可能不是1而是其它数字,注意figure窗口标题上的Figure n里的n)
>>legend hide
>>xlabel ‘1/32 degree, mm/day’
>>ylabel ‘Frequency’

此时效果如下,

image

5. 修改figure格式

设置figure为Tools-> edit plot状态,打开View->Property Editor。

将histogram的plot type从line改成Area,配置合适的face color和edge color。

将x轴的范围X Limits设置为0 to 100。

image

这时,histogram压着拟合曲线,选择拟合曲线,右键Cut后,再Paste进来,可以将拟合曲线带到最上面。

6. 修改数据

注意到目前为止,Y轴仍是Density。我们需要将Y坐标修改为Frequency(或者count)。Count=Density x bin width x data count,这里bin width是5,data count是43。因此,我们需要对Ydata乘以5×43=215。

选择拟合曲线,

>>ydata=get(gco,’YData’)
>>ydata_215 = ydata*215
>>set(gco,’YDATA’,ydata_215)

选择histogram,

>>set(gco,’YDATA’,get(gco,’YDATA’)*215)

修改xlim和ylim

>>ylim([0 10])
>>xlim([0 100])

将figure还原为非编辑状态。Tools->Edit Plot,并关闭Property editor。

image

以上步骤中数次修改xlim和ylim,并不是每次都需要,这里仅是为了演示需要。

7. 保存图形

>>print -dpng ‘histogram_dist.png’

在figure对话框的File-> Save As…保存为MATLAB Figure(.fig),以后可以通过File->Open…打开。

结论

本文演示了如何使用Matlab对数据的histogram使用Gamma分布进行拟合。介绍了matlab的常用命令,Distribution Fitting Tool,figure的格式化编辑功能,对figure对像数据的修改等。也介绍了比如如何调整figure里对像的z-order等实用技巧。

data.for.hist.txt