Zhuotong Nan (南卓铜, [email protected])
DEM processing
In this part, we will show you how to delineate a watershed with inputs of DEM(Digital elevation model) and outlet location. Watershed delineation is necessary for any distributed hydrologic model. Although hydrologic models use different software to implement the delineation, the underlying idea and steps are generally common.
1. Open PIHMgis by double clicking the PIHMgis_v2.0.0 shortcut created in the previous section.
2. Enable PIHMgis.
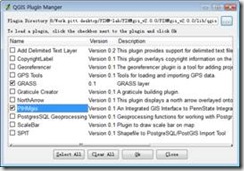
Open Plugin Manager… in the QGIS Plugins menu, tick the PIHMgis item (Figure 3), and press Ok.
Figure 3 QGIS Plugin Manager
Now the PIHMgis toolbar appears as shown in Figure 4.
Figure 4 the PIHMgis v2.0.0 toolbar
3. Load DEM to PIHMgis for displaying.
Layer > Add a Raster Layer…, select lab3.shale.hillsDEMsh_elev.asc.
This DEM file is in ESRI ASCII grid file format. If you have files in ESRI binary grid format which is a proprietary format, you need to convert them to ASCII format by using some ArcInfo command or by some third party tool, such as gdal_translate available from the GDAL website at http://www.gdal.org/.
The map view of the DEM file looks like as following (Figure 5),
Figure 5 DEM map view in QGIS
4. Save as a QGIS project. File > Save Project As…, in the Save As dialog, navigate to the directory of lab3.shale.hills, type “sh” for the file name, and then click Save.
Note: During following steps, please save the project frequently. If the project is crashed, you can restore to the previous session by open the project you saved.
5. Fill pits.
Question: Why do we need to fill pits for a DEM file prior to further watershed delineation?
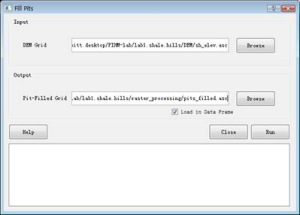
Click the small arrow next to the Raster Processing on the PIHMgis toolbar and then select Fill Pits. This will bring up the Fill Pits dialog (Figure 6).
Figure 6 The Fill Pits interface
Select sh_elev.asc as the input DEM grid and name the output pit-filled grid as “pits_filled.asc” under the “raster_processing” directory as shown in Figure 6. Press Run to start the pit filling process. Click “Close” to dismiss the dialog after the process is done. The pit-filled DEM will automatically be loaded into the QGIS data frame.
6. Calculate flow direction and flow accumulation.
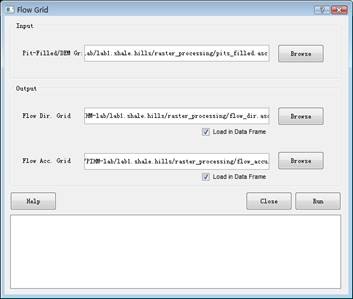
Use the command Raster_Processing > Flow Grid to open the Flow Grid window (Figure 7).
Set pits_filled.asc as the input; flow_dir.asc and flow_accu as the output flow direction grid and flow accumulation grid respectively, also under the raster_processing folder.
Click Run to start the processing. After done, click Close.
Figure 7 Flow Grid
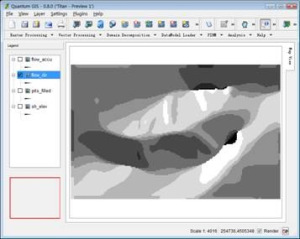
Both flow_accu and flow_dir are shown in the QGIS map view (Figure 8).
Note: the direction codes are following: 1 – east, 2 – North east, 3 – North, 4 – North west, 5 -West, 6 – South west, 7 – South, 8 – South east.
Figure 8 Flow direction generated by PIHMgis
Tip: Within the QGIS framework, visibility of a GIS layer can be switched using the table of contents on left.
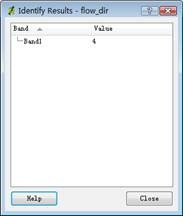
Tip: The identify tool ![]() can be used to identify features by clicking on them in the right map view panel. For example, click on the flow_dir item in the table of contents to make it selected, and then use the identify tool to click over the map view, the Identify Results dialog will pop up and show the value of the clicked feature (Figure 9), here, value of 4 means the point of interest has a flow direction towards north west.
can be used to identify features by clicking on them in the right map view panel. For example, click on the flow_dir item in the table of contents to make it selected, and then use the identify tool to click over the map view, the Identify Results dialog will pop up and show the value of the clicked feature (Figure 9), here, value of 4 means the point of interest has a flow direction towards north west.
Figure 9 Identify results
7. Generate stream grid
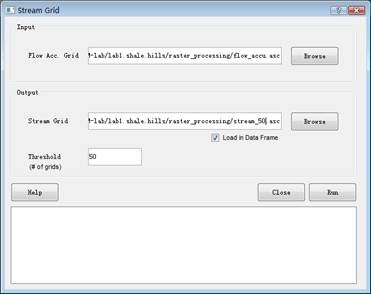
Select Raster Processing > Stream Grid to make the Stream Grid dialog visible, set the flow accumulation grid generated in previous step, i.e., flow_accu.asc, as the input grid, and then set output stream grid to stream_800.asc with a threshold value of 800 (number of grids). Press Run to generate stream grid (Figure 10).
Figure 10 Generate stream grid with a threshold value of 50.
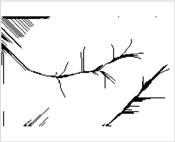
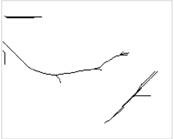
Don’t close the Stream Grid window. Set thresholds to 300 and 800 respectively to compare the resulting stream grids (stream_300 and stream_800 accordingly, Figure 11) and run again.
Figure 11 The generated stream grids with thresholds set to 50, 300 and 800. (left: 50, middle: 300, right: 800)
Close the Stream Grid dialogue by clicking on the Close button.
Question: How to determine an appropriate threshold for a watershed of interest?
8. Generate the stream order grid (known as Link Grid in PIHMgis)
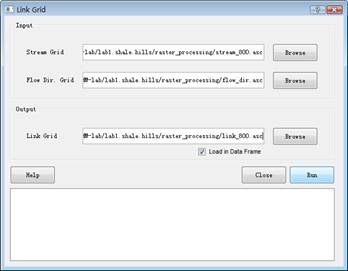
Select Raster Processing > Link Grid to pop up the configure interface (Figure 12). Select stream_800.asc as the input stream grid and flow_dir.asc as the input flow direction grid, and set the output link grid name to link_800.asc (saving to the same raster_processing folder). Click Run to begin processing. After done, the link grid will be shown on the map view panel if the Load in Data Frame option is checked.
Figure 12 Generate a stream order grid
9. Create a vector file of stream network
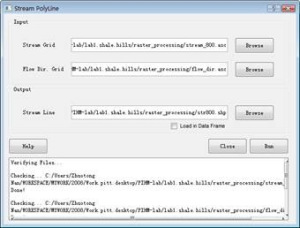
Select Raster Processing > Stream PolyLine to make the interface appear (Figure 13). Set inputs with stream_800.asc and flow_dir.asc generated by previous steps and set the name of the output stream polyline file to str800.shp. Click Run to process it after parameters are specified.
Figure 13 Create a vectorized stream network
10. Generate catchment grid and its corresponding vector file
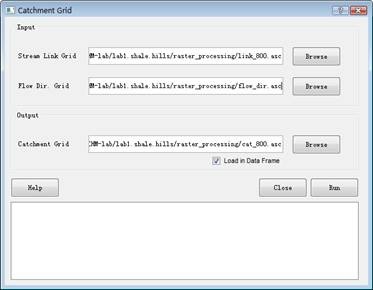
Select Raster Processing > Catchment Grid to bring up the catchment grid generation interface (Figure 14). Set Stream Link Grid to link_800.asc, Flow Dir. Grid to flow_dir.asc, and output Catchment Grid to “cat_800.asc”. Both input and output files are located in the raster_processing directory.
Click Run to start calculating the catchment grid. Click Close to dismiss the dialog.
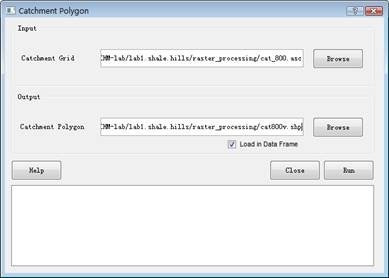
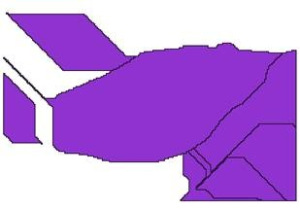
Select Raster Processing > Catchment Polygon to display the interface for converting grid catchment file to vector (Figure 15). Set input to cat_800.asc and output to cat800v.shp. Run to start the processing and Close to dismiss the window. The resulting catchment polygons are shown on Figure 16. Note: the color to render the polygons might not be same as that on the Figure 16, as it is determined by QGIS automatically.
Figure 14 Catchment grid generation interface
Figure 15 Convert catchment grid to vector
Figure 16 Resulting catchment polygons
11. Extract the watershed boundary of interest
The current PIHMgis version 2.0 does not provide such a function to clip the watershed boundary under study and stream network within it. We need to do this by help of other GIS software such as ESRI ArcInfo, or by using QGIS editing capability demonstrated below. In the future version of PIHMgis, this functionality will be implemented. To determine the boundary of a watershed, the outlet location should also be specified.
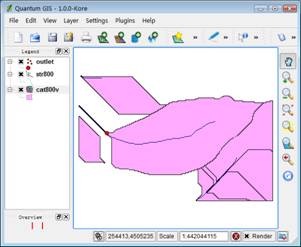
Open QGIS 1.0, load cat800v.shp and str800.shp generated in previous steps to the data frame using Layer > Add Vector Layer…, and then load outlet.shp, which contains outlet location. The view now looks like Figure 17.
Figure 17 QGIS 1.0 with stream network, catchment polygons and outlet layers loaded
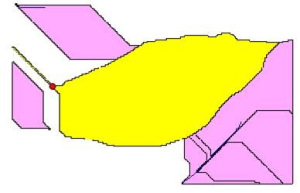
Click on cat800v within the table of contents to make it the current layer. Use “Select Features” tool (Figure 18) to select the watershed polygon of interest (Figure 19). The selected polygon is now in yellow. If the tool is invisible, just drag the toolbar to a new place to make fully appeared.
Students are advised to have a look at all built-in toolbars, making them familiar with all those often-use tools.
Figure 18 The Attributes toolbar
Figure 19 Select the watershed of interest
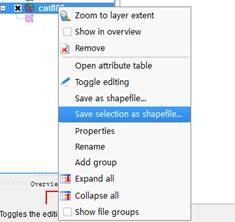
Right click the cat800v item and select “Save selection as shapefile…” to save the selected polygon (Figure 20) to a new shapefile, here, “cat800v_sel.shp”, under the “raster_processing” folder. If you are required to select a project, click OK to use the default one.
Note: The default project probably is not correct, but does not matter with following operations. You can change the project in a layer’s property window later.
Figure 20 Save selection as a new shapefile
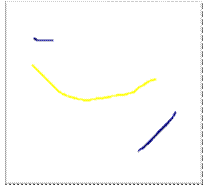
Similarly, select the corresponding stream from str800 and save as a new shapefile “str800_sel.shp” (Figure 21), also into the “raster_processing” folder. If you are required to select a project, click OK to use the default one.
Figure 21 Select the corresponding stream, shown in yellow.
Load str800_sel and cat800v_sel into the QGIS map view. Drag layers up or down to rearrange layers’ visibility. Uncheck str800 and cat800v to hide them. Now the map view looks like Figure 22.
Figure 22 Load str800_sel and cat800v_sel and hide str800 and cat800v
Make str800_sel disappear. Select “cat800v_sel” layer, and use “zoom in” tool (the one w/ magnifier icon and a plus symbol shown in Figure 23) to enlarge the area near the outlet. Click “Toggle editing” tool (the one w/ pen icon shown in Figure 23) to make the current layer editable (Figure 23). Now the other tools on the Digitizing toolbar are also available when the layer enters into edit mode. The tools may be hidden, in this case drag toolbars to a blank place to make all tools shown.
Figure 23 cat800v_sel in edit mode
Click the Split Features tool. Draw a curve to cross the outlet so as to split the whole polygon. Right click to finalize the curve; the Split Features will then split the polygon. Click the “Toggle editing” again to make the layer back in the normal view mode. Make sure saving it if you are asked to save the features.
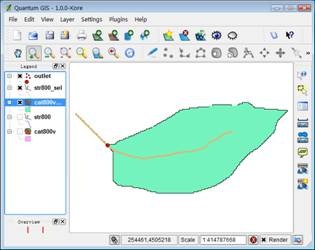
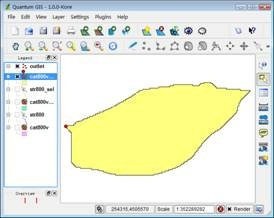
Use “Select Features” tool to select the large polygon right to the outlet. If the previous operation has been done successfully, only the large part will be selected and the upper left part remains unselected. Save the selected polygon to a new shapefile named “cat800v_clip.shp”. Load cat800v_clip to the map view. It now looks like as shown on Figure 24.
Figure 24 Clipped watershed boundary
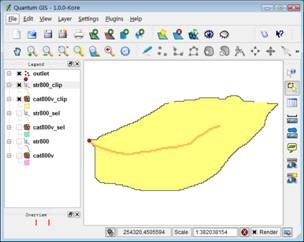
Similarly, we also split the str800_sel.shp. Make it visible and editable, draw a curve to split it across the outlet, save the operation, and then export the desirable line (on the right) to a new shapefile, “str800_clip.shp”. (Figure 25)
Figure 25 Clipped stream network
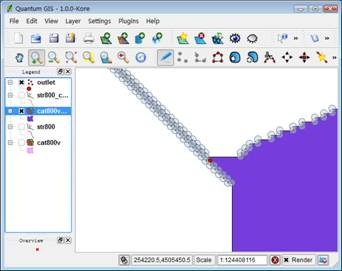
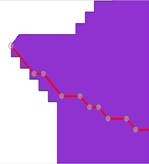
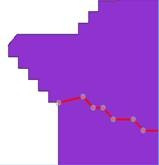
Zoom in the outlet area, and carefully edit the stream polyline making its end node locate on the watershed edge. However no necessary exact alignment is needed. Tools for vertex editing are shown in Figure 26. The final stream line looks like as in the Figure 27. Save the stream file after done.
Figure 26 vertex editing tools. Left: move vertex; middle: add vertex; right: remove vertex
Figure 27 Align the end node of stream line to the boundary. Left: original; right: edited
Close QGIS 1.0.
