由上海长三角湿地生态系统国家野外科学观测研究站打造的“智慧青西”平台(https://smartqingxi.permalab.science)正式上线啦!
“智慧青西”是一个致力于将前沿科技与自然生态保护紧密结合的轻量交互地图平台。它的初衷是为游览上海青西郊野公园的公众以及从事生态研究的科研人员,提供一个直观、智能、便捷的数字空间。在这里,你不仅了解公园的美丽风光,还能深入探索生态气象观测站、碳通量观测塔等硬核科研设施的分布与功能。
平台拥有四大技术亮点:
Continue reading由上海长三角湿地生态系统国家野外科学观测研究站打造的“智慧青西”平台(https://smartqingxi.permalab.science)正式上线啦!
“智慧青西”是一个致力于将前沿科技与自然生态保护紧密结合的轻量交互地图平台。它的初衷是为游览上海青西郊野公园的公众以及从事生态研究的科研人员,提供一个直观、智能、便捷的数字空间。在这里,你不仅了解公园的美丽风光,还能深入探索生态气象观测站、碳通量观测塔等硬核科研设施的分布与功能。
平台拥有四大技术亮点:
Continue reading事件重现:
一个dem raster数据,对其做spatial analyst > neighborhood > focus statistic,取值最大值,然后进行 reclass > reclassify。focus 能正常生成,但在reclassify 的时候提示:
The name of the Field is invalid: valid names may contain letters, numbers or underscores.
里面的大概story 是这样(猜的),dem 是中文平台上生成,采用的编码大概是 gbk 之类的,做focus 时会生成一些dbf 字段,于是也采用 gbk,但reclassify 大概采用utf 去读gbk,于是不识别。
我采用的方法是:
新建personal geodatabase,将 dem import 进这个gdb,然后做 focus & reclassify。
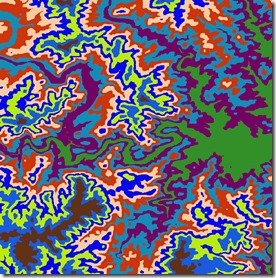
最后的图蛮漂亮的。

Arc/Info Generate 格式已经有点历史,现在版本的ArcMap 都不能直接支持对该格式的读取。但由于Generate 格式对矢量数据模型的表达十分简明,在教学中仍然还广泛提及。为了看看Generate 文件的地图效果,需要把该格式转为Shapefile 等格式,才能在ArcMap 中显示。
第一种转换的方法是使用ArcGIS 的Data Interoperability 模块
ArcGIS Desktop 里需要安装 Data Interoperability 模块,在ArcMap Extension 里将该模块打勾,然后通过 ArcToolbox 下的 Data Interoperability Tools 里的Quick Import 将Generate 文件导入到Shapefile 或者 Geodatabase。
Data Interoperability 实际上是调用了内置的FME Reader 来实现格式互转,ArcInfo Generate 的短名是ARCGEN。如果Generate 文件后缀是.gen,在import时可以被自动识别;如果不是.gen,则需要手动设置输入格式是ARCGEN。
第二种转换方法是使用第三方工具 gen2shp (提供可执行文件下载)
Personal geodatabase是利用Access数据库进行ESRI Geodatabase数据模型的物理存储。以前是不支持栅格数据的存储,矢量数据都放在一个.mdb里,很方便将这个mdb文件拷贝给别人。当然Personal GDB只支持Windows,但因为国人多数只用Win平台,一般不是大问题。
任一种GDB拷贝给别人的时候,都会关注版本的问题,如果自己的ArcGIS版本太高,一般默认的是GDB版本也高,他人如果是使用较低版本的ArcGIS是无法打开高版本的GDB的,所以最好将GDB版本降到9.x再给别人。
Personal GDB现在是支持栅格,这时,应该拷贝给别人的文件除了.mdb外,还要包括一个xxx.idb的文件夹,这里xxx是GDB的名字,注意这是一个文件夹的名字。如果忘了拷贝这个idb文件夹,他人收到是无法打开其中的栅格文件,但其中的矢量文件是可用的。最近我给他们拷贝时就发生这个的问题。
事实上,这时候Personal GDB就失去了以往单一文件便于传递的优势了,我建议不如使用File geodatabase这一不受平台限制的GDB格式。
在Arcmap 10的Python Window里执行 MosaicToNewRaster_management时,按其文档给出的例子对应修改各个参数,发现总是提示Cannot set input into parameter coordinate_system_for_the_raster错误,即投影文件参数没有设对。
ArcGIS 10文档里的例子:
arcpy.MosaicToNewRaster_management(“land1.tif;land2.tif”, “landnew.tif”, “World_Mercator.prj”, “8_BIT_UNSIGNED”, “40”, “1”, “LAST”,”FIRST”)
函数原型:
MosaicToNewRaster_management (input_rasters, output_location, raster_dataset_name_with_extension, {coordinate_system_for_the_raster}, {Pixel_type}, {cellsize}, Number_of_bands, {mosaic_method}, {mosaic_colormap_mode})
仔细对照其参数列表,发现参数列表里比例子多了一项,即在投影参数前有两项,一项是输出位置,一项是输出文件名,而不是列子里只有一项。修正后问题仍然存在。
不过现在的问题是找不到投影文件.prj,将之扩展为绝对路径即可以执行。
我猜ArcGIS文档里一些例子是以前版本的,在新版本里参数发现了变化,但例子没有及时更新过来。所以大家在使用时,还是不能尽相信例子,当发现问题的时候,对照函数原型会更靠谱。
一种简单有效的MODIS LST内插方法
Zhuotong Nan ([email protected], 南卓铜)
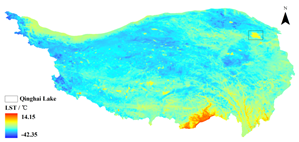
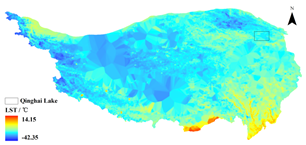
本软件实现了一种新的基于相似性原理的MODIS陆表温度(LST)的插值方法。这种LST数据空间插值方法利用具有相似温度变化特征的已知LST像元集合推算缺失的LST。在青藏高原的案例表明传统的地统计方法基本无法处理大范围连续的数据丢失(比如因为云),而本方法明显优于传统方法,可能较合理的得到缺失LST。此方法尤其适用于大范围山地区域。
This tool implements a new interpolation method for MODIS land surface temperature (LST) following the theory of similarity. It estimates the missing LST pixels by known LST pixel sets which bear similar characteristics of LST variation as the missing pixels. A case study on the Qinghai Tibet plateau has already been carried out, showing its obvious advantages over the traditional geostatistic methods, the latter was unable to do with a large area and temporally continuous data missing situations. This approach is especially good for a study area with a large area and mountainous terrain.
fig 1a, with this approach
fig 1b, with Kriging
Workflow of Preparing Stream Data for DHSVM
Zhuotong Nan (南卓铜, [email protected])
Preparing stream data for DHSVM is very complicated. Many AML scripts as well as Java are involved. Through the example showed below, I want to examine what the preparation really does and what happens behind the scripts. The scripts need ArcGIS workstation, which is not commonly installed. Thus I wrote this article, in the hope that without installation of ArcGIS workstation, you can see clearly the processes and if you want you can re-implement it with other languages.
I created a folder named “highplandpark” on the desktop, whose actual path is c:usersnztdesktophighlandpark. The contents in this folder include,
Those files can be found here.
In order to repeat the following steps, ArcGIS Desktop and Workstation, Java Runtime Environment JRE, shall be installed as prerequisites. I used version 10.0 for both ArcGIS Desktop and Workstation and JRE 7. My OS is Windows 7 x64.
Read the 18-page full document, pdf (478KB)
Two attached files
我在前面的帖子(previous post)介绍了用ArcGIS读取GIMMS AVHRR NDVI 3g格式的数据文件的方法,但并不十分好用。所以写了一点代码,用于方便的将之转换为ESRI ASCII Grid栅格,后者可以很容易的被GIS软件支持。
从这个帖子可以下载到相关的代码和样例ndvi3g数据。
注意运行代码需要 Matlab的支持。
Purpose: Convert GIMMS Global AVHRR NDVI 3g files to ESRI ASCII Grid, which is very easy to be accessed with popular GIS software.
Author: Zhuotong Nan ([email protected])
Web: https://nanzt.info
Date: Sep 11,2014
Last update: Nov 3,2014
Please distribute codes with this header attached.
Usage:
type convert_ndvi3g_ascii in Matlab to run
Open convert_ndvi3g_ascii.m, modify the ndvi3gfl variable to make it point to the ndvi 3g file you wanto to convert.
After run, three grid files will be created. One is the grid
corresponding to the 3g data file, the other is the ndvi grid extracted from the 3g data file, and the last one is its associated flag grid.
Files included with this code:
The meaning of the FLAG:
FLAG = 7 (missing data)
FLAG = 6 (NDVI retrieved from average seasonal profile, possibly snow)
FLAG = 5 (NDVI retrieved from average seasonal profile)
FLAG = 4 (NDVI retrieved from spline interpolation, possibly snow)
FLAG = 3 (NDVI retrieved from spline interpolation)
FLAG = 2 (Good value)
FLAG = 1 (Good value)
Nov 3, 2014
Fix bugs that wrongly computing ndvi.asc and flag.asc
Sep 11, 2014
Initial version
Download codes (9,875KB); Link2 (Baidu)
78ae077b84d7455913382971da7731ef soft.ndvi3g.11032014.zip
Download codes (6,483KB)
MD5: 006d2d630a5c94f3ca629fc9f751d7f1 soft.ndvi3g.zip
用ArcGIS读取GIMMS AVHRR NDVI 3g 数据
这个第三代NDVI数据,文件名类似于geo82dec15a.n07-VI3g ,增加.bsq扩展名,比如geo82dec15a.n07-VI3g.bsq。
然后建立一新文件,文件名与ndvi文件名一致(不包括.bsq),扩展名为 .hdr,如geo82dec15a.n07-VI3g.hdr。把此.hdr与nvdi文件放在一起。.hdr是个文本文件,内容包括:
nrows 4320
ncols 2160
nbands 1
nbits 16
pixeltype SIGNEDINT
byteorder M
layout bsq
在arcgis里就可以以栅格的形式打开。不过遗憾的是,由于ndvi 3G文件好像写数据的次序与arcgis不一样,所以读出来是倒置的。
在ArcGIS里做一个栅格transpose rotate,就是正确的图像。然后增加正确的坐标信息,在正确位置下,坐标信息如下:
upper-left-lat: 90.0-1/24
upper-left-lon: -180.0+1/24
lower-right-lat: -90.0+1/24
lower-right-lon: 180.0-1/24
Geographic Lat/Lon
pixel-size: 1/12=0.0833 degrees
因ndvi3g读过来的数据中包括flag信息。用raster algebra计算ndvi时,用以下公式,
ndvi = rounddown(ndvi3g / 10) / 1000
标志flag
flagW = ndvi3g – rounddown(ndvi3g / 10) * 10 + 1
(注意栅格运算时,操作符之间是必要有空格的。)
标志含义
The meaning of the FLAG:
FLAG = 7 (missing data)
FLAG = 6 (NDVI retrieved from average seasonal profile, possibly snow)
FLAG = 5 (NDVI retrieved from average seasonal profile)
FLAG = 4 (NDVI retrieved from spline interpolation, possibly snow)
FLAG = 3 (NDVI retrieved from spline interpolation)
FLAG = 2 (Good value)
FLAG = 1 (Good value)
由于Arcgis需要多个操作,建议用Matlab或别的编程语言自己写点代码来处理。
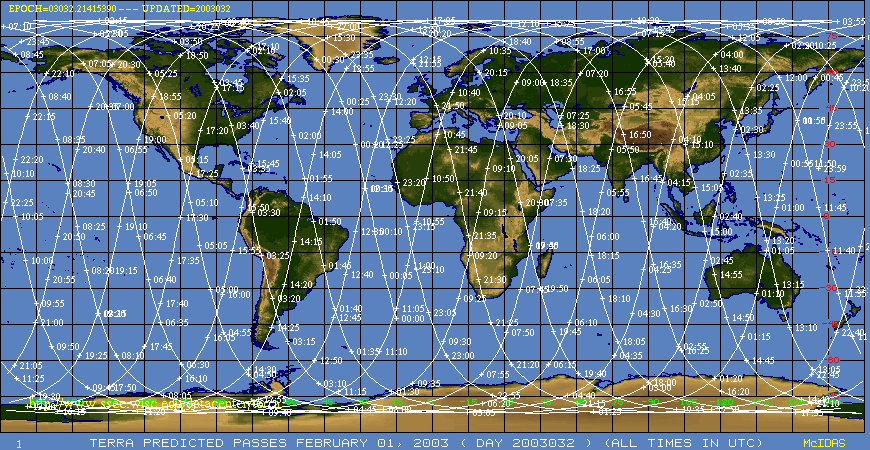
我有一个帖子 “MODIS过境时间及相关”描述了modis过境时间的问题。期间收到不少朋友同学的咨询。前些天一个学生在做amsr-e的与气象台站数据对比时,也犯了类似的错误。我再补充说明一下过境时间与北京时间的关系。这个关系,当要对比卫星观测数据和气象台站数据(国内气象台站以北京时计时)时,一定要注意。还是以Terra为例。先举一张过境时间的图。

注意terra, aqua都是太阳同步卫星,在固定时间经过赤道(如terra在local time 10:30降轨经过赤道),但千万不要等同于是北京时间10点半经过我们上空。
我注意到一个同学给我的信里讲,terra穿过整个中国也就9分钟,所以如果不需要精确时间的话,可以近似用经过赤道的local time。这里问题主要是出在时区上。
注意我上面帖的图,轨道是斜着的,意味着几分钟后卫星可能进入另一个时区。然而当从境外进入中国,由于中国采用统一的北京时间(utc+8),不管原本应该是哪个时区(local time与这个有关),马上就变成 utc+8了。比如乌市原本应该是在东6时区,卫星经过乌市原本地方时应该是 utc+6,但乌市的气象台站观测是以北京时为准,变为utc+8了。
所以拿过境时间与北京时对比时,就会出现2个多小时的偏差了。
此外,中国陆域面积大,中国区域的数据可能是多次升、降轨合成的,各个地方的过境时间并不一致。
如果需要匹配时间,建议使用数据集里带的时间信息(是以utc标准的),加以自动转换到北京时,然后对比。