Zhuotong Nan ([email protected]), CAREERI/CAS
TopMODEL is a conceptual hydrological model which was initially released in 1979 but is still widely used today especially in a watershed simulation with sparse observations. TopMODEL uses topographic index (TI) to calculate water flow. There are already some tools developed for TI computation. Here I want to present a method using ArcGIS.
There is a similar work at http://soilandwater.bee.cornell.edu/Courses/GIS/TI.ppt. What I will present will be more than it.
1. We have a DEM which is large enough to cover our study area. The DEM “Heihe_SRTM.img” is subset from the SRTM 90m data which is in lat/lon coordinates (WGS84).
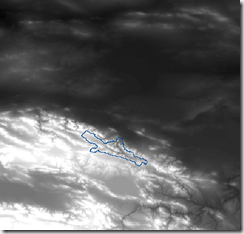
2. Open ArcToolbox, go to Data Management Tools > Projections and Transformations > Raster > Project Raster.
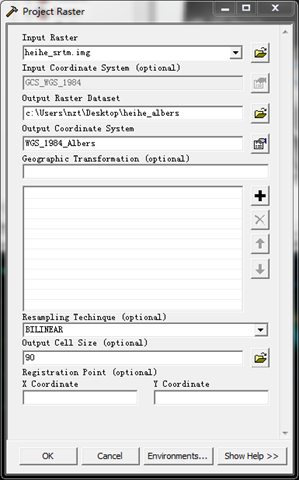
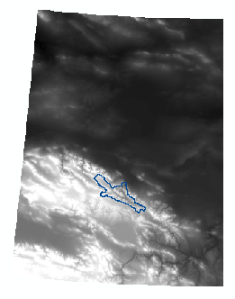
Here use bilinear to interpolate the input raster to a 90m resolution grid in the Albers equal area projection. The resulted raster is “heihe_albers”.
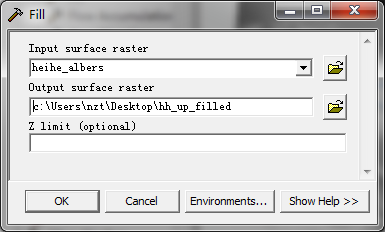
3. In ArcToolbox, Spatial Analyst Tools > Hydrology > Fill, to fill up the possible sinks, resulting “hh_up_filled”.
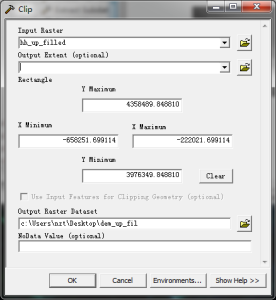
4. In ArcToolbox, go to Data Management Tools >Raster > Raster Processing > Clip, to make the filled DEM smaller, because the next steps are very computation intensive. “dem_up_fil” is created.
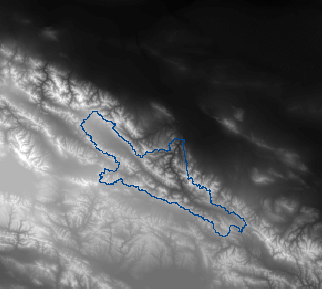
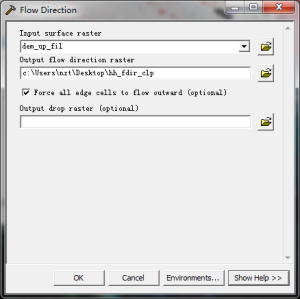
5. Hydrology > Flow direction. Note, use the filled DEM. flow direction file is “hh_fdir_clp”.
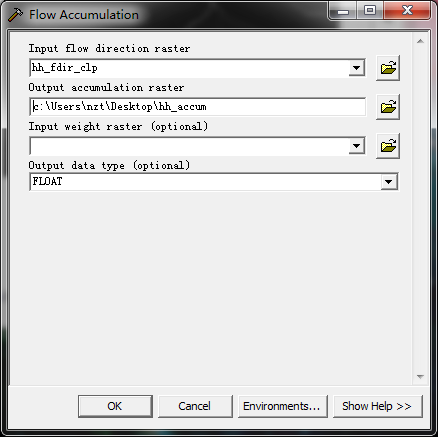
6. Hydrology > Flow Accumulation to compute “hh_accum”
7. open hydrosta.shp. this is a hydrological station location shapefile. We use the red line surrounded site as the watershed outlet.
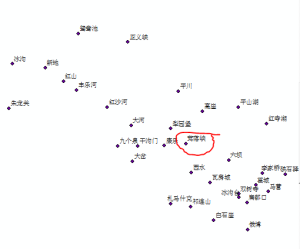
8. use the “select feature” to select the desired site

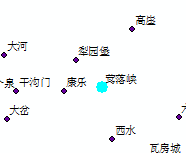
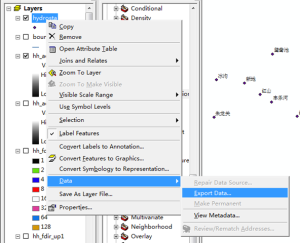
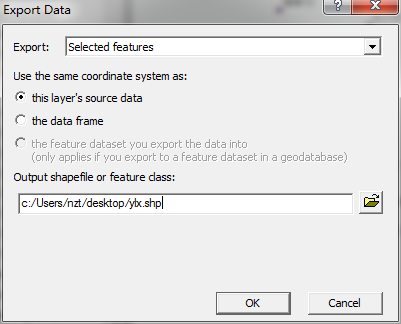
9. export to a separate file. the exported ylx.shp now is in same projection as hydrosta.shp which is lat/lon.
10. Data Management Tools > Projections and Transformations > Feature > Project. save as “ylx_alb.shp”.
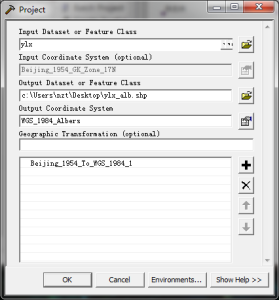
the output coordinates can be imported from the heihe_albers raster.
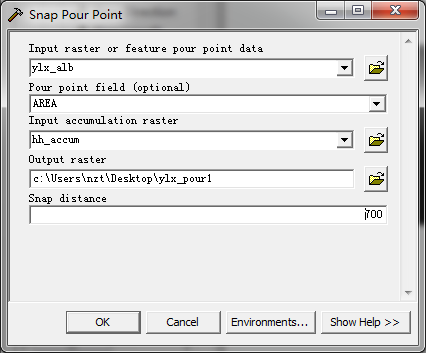
11. Hydrology > Snap Pour point. Carefully select the snap distance which is in map units. The result is “ylx_pour1” grid.
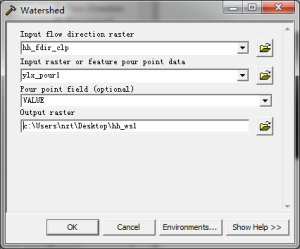
12. Hydrology > Watershed to delineate the watershed. Now we have “hh_ws1”.
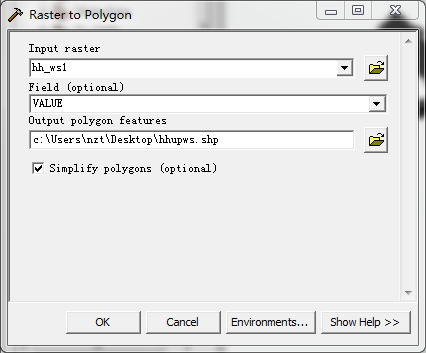
13. ArcToolbox > Conversion Tools > Raster to Polygon to create “hhupws.shp”
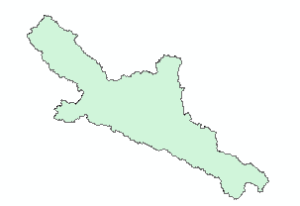
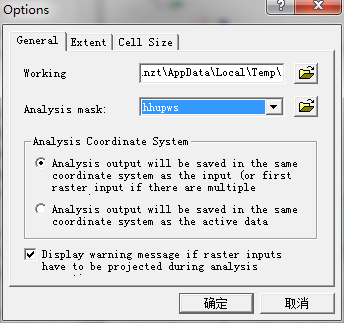
14. Open Spatial analyst toolbar (right click on the blank space of menu bar, select Spatial Analyst), set Spatial Analyst > Options > Analysis mask to hhupws (the watershed boundary polygon)
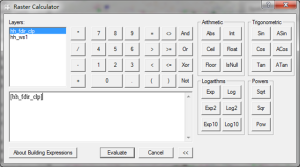
15. Spatial Analyst > Raster Calculator, double click hh_fdir_clp, and then click Evaluate. This will make the hh_fdir_clp masked by the watershed boundary.
Make the generated Calculation layer permanent (right click the item in the TOC, Data > Make Permanent…). Save as “hh_fdir_up1”.
Do same to dem_up_fil; dem is clipped to “dem_upstr1”.
Do same to hh_accum to generate “hh_accum_clp”
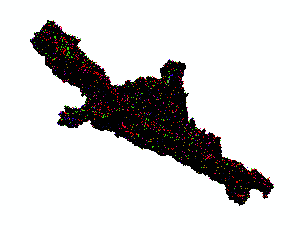
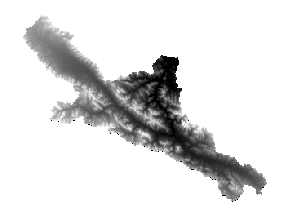

hh_fdir_up1 (left), dem_upstr1 (middle) and hh_accum_clp (right)
16. Hydrology > Flow Length
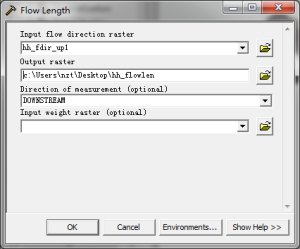
the flow length raster “hh_flowlen” is used to calculate channel levels in the SUBCAT file.
17. Spatial Analyst > surface analysis > Slope
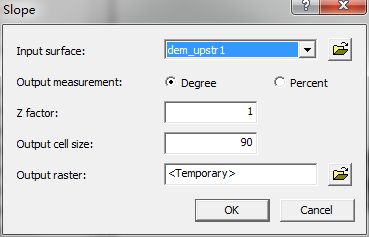
save the slope file as “Slope_filldem”
18. Spatial Analyst > Raster Calculator
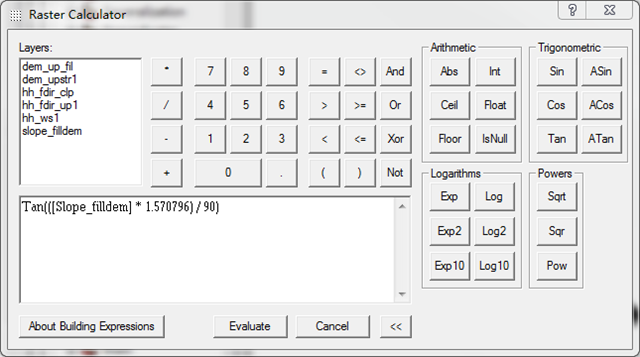
use “Tan(([Slope_filldem] * 1.570796) / 90) ” to calculate tangent of slope radians
save to “tan_slope1”
19. Same in Raster Calculator
Calculate TI by typing “Ln((([[hh_accum_clp]] + 1) * 90) / [[slope_filldem]] )”
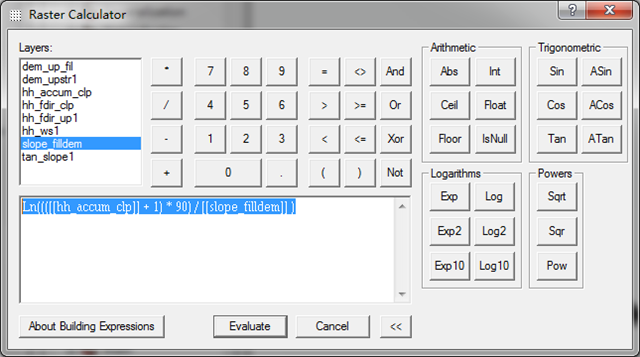
save to “ti1”
Now we have data ready. What we do next is to classify data and make data formatted to fit what Topmodel requires.
20. Select ti1, then click Spatial Analyst > Reclassify … In the window, click Classify, select Equal Interval as the method, set 29 as the classes, click Ok to accept it. Other classification methods also can be used for your cases. You also can set more classes. but keep in mind that the TopModel version might be have limitation on classes.
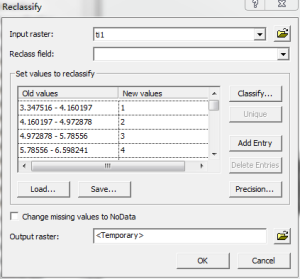
click “Save…” , save the classification schema to “ti_table” as info table
Click ok to classify the continuous TI grid. a new layer “Reclass of ti1” is added to TOC. select it and right click to bring up the context menu. Open Attribute Table, and then Options > Export all records to “ti_export.txt”.
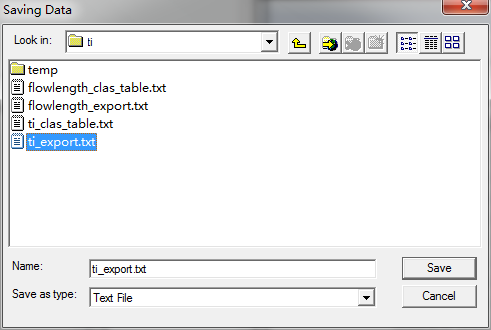
Note, the Save as type should be selected as “Text File”. It might not work if you only specify an “.txt” extension.
Do same to the hh_flowlen. classify it to 9 classes. and export the data to “flowlen_export.txt” in a text format. The classification schema is saved to “flowlen_table”.
21. In ArcGIS, click Add data to adding flowlen_table and ti_table to the ArcGIS session. Right click on each item, open the table, and export all data to text files, here, “flowlength_clas_table.txt” and “ti_clas_table.txt”, respectively.

22. Open Excel. drag “flowlength_clas_table.txt”, "ti_clas_table.txt”, "ti_export.txt”, and “flowlen_export.txt” to Excel.
In each Excel workbook, select the first column, click “Text to Columns” in the data tab of Excel 2007. in the earlier version, there is also similar commands.
select comma as the delimiter, click finish.
Copy “From_”, “To_”, “Out” columns in class schema files, append to ti and flowlen export data workbooks respectively. This step is to combine the schema to actual data. after appending, close the two class table files (“flowlength_clas_table.txt”, "ti_clas_table.txt”) without saving changes. Now we have something like that,
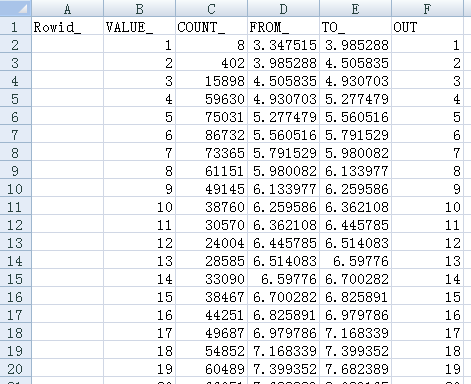
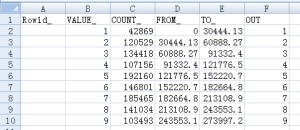
The combined ti_export.txt workbook(left) and the combined flowlen_export.txt workbook (right)
23. In the ti_export.txt workbook, select the “OUT” cell, click reverse order command  .
.
Right to the “OUT” column, add “Area”, and then “TI”.
In the cell below the title “Area”, type: =c2/sum($c$2:$c$30). this will calculate the fractional area. Note, $c$30 indicates the last low of the data. You might change it accordingly when you have different classes. Copy this cell to propagate through the Area column.
In the cell below the title “TI”, type: =D2. Copy this cell to propagate through the Area column.
Insert a new row right below the header row where we set area to 0, and ti to “=E3” (the largest TI). like below in this time,

Save the result to a new Excel file, say, “ti_ready.xlsx”.
24. In the flowlen_export.txt workbook, right to the “OUT” col, add “area”, “accum_area”, and “dis” in the next two cells.
use “=C2/SUM($C$2:$C$10)” to calculate the area column; note, $c$10 is the last data line. change it accordingly.
use “=SUM($G$2:G2)” to calculate accumulative area for the accum_area column;
use “=e2” to calculate the dis column.
copy those formula to other rows.
insert a new line immediately below the header line. type 0 and 0 for accu_area and dis. if this is a subcatchment, set the distance from the outlet of the entire catchment to dis here.
looks like as below,

save the excel to “flowlen_ready.xlsx”
close ti_export.txt and flowlen_export.txt, no need to save changes.
Note, we do not need to reversely sorting data which is different from the ti case described above.
25. copy “area” and “ti” in the ti_ready.xlsx (without header) to the proper section of the SUBCAT file.
copy “accum_area” and “dis” in the flowlen_ready.xlsx (without header) to the proper section of the SUBCAT file.
in this case, the total ti increments are 30; the total channel levels are 10. looks as below,
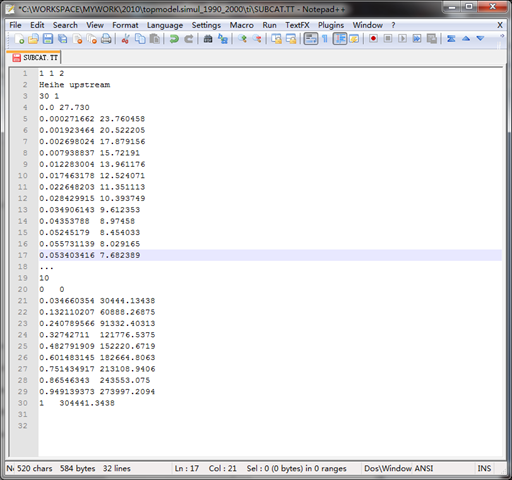
For the demonstration purpose, we abbreviate 30 ti increments.


